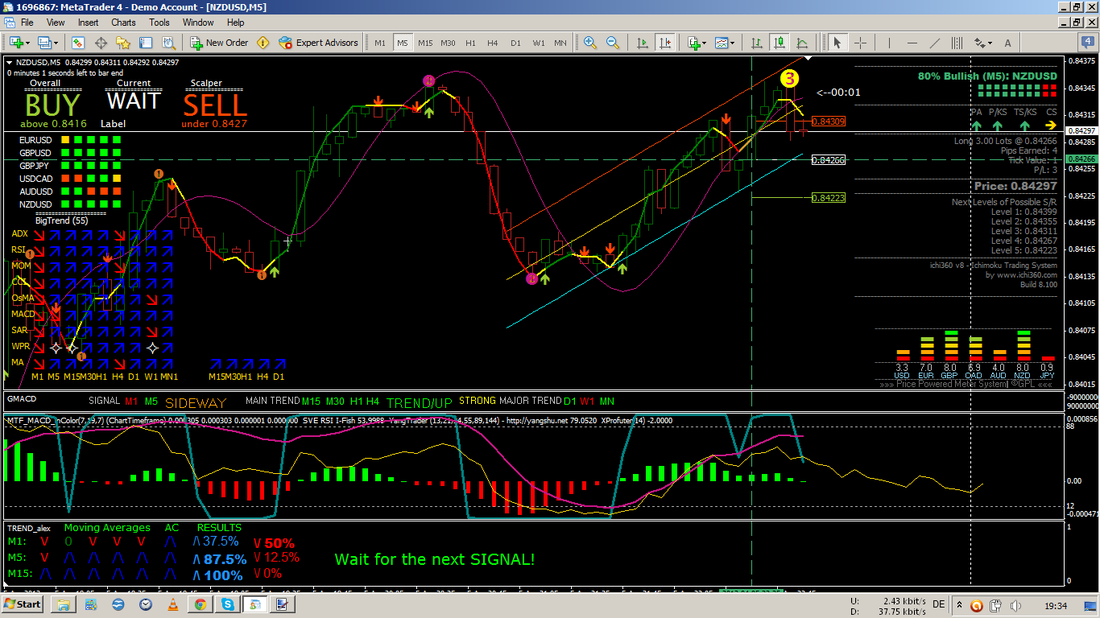
My Chart Set-Up
|
Main Window -
X Meter Indicator : P4L Candle : Ichi360v8 : Trend Multi Signal JJN-Nugget : JJN- Bee : JJN-Scalper : JJN-BigTrend Liniar Regression : LSMA In Colour : Yang Trader Main 3 Level ZZ Semafor Indicator 1 - GMACD Signals Indicator 2 - MTF MACD in Colour : SVE RSI i-Fish : Yang Trader xPortfutterDD Indicator 3 - Trend Alexcud v2MEn
|
||
Trend Indicators:
|
|
The indicator gives clear signals. Red bars indicate that the pair is below its average and fell below the overbought level. Green bars indicate that the pair is above its average and climbed above the oversold level. Yellow bars shows that the pair lacks momentum.
Linear Regression Channel indicator is very easy to use as support and resistance strategy. Red line represent resistance, when price touches or breaks red line, sell. Blue line represent support, when price touches or breaks blue line open long position.
|
